Mining Tyre KPIs Every Maintenance Manager Should Track
Cost per hour is only the start. These are the mining tyre KPIs that show where tyre money is going, why tyres come off early and what to fix first.
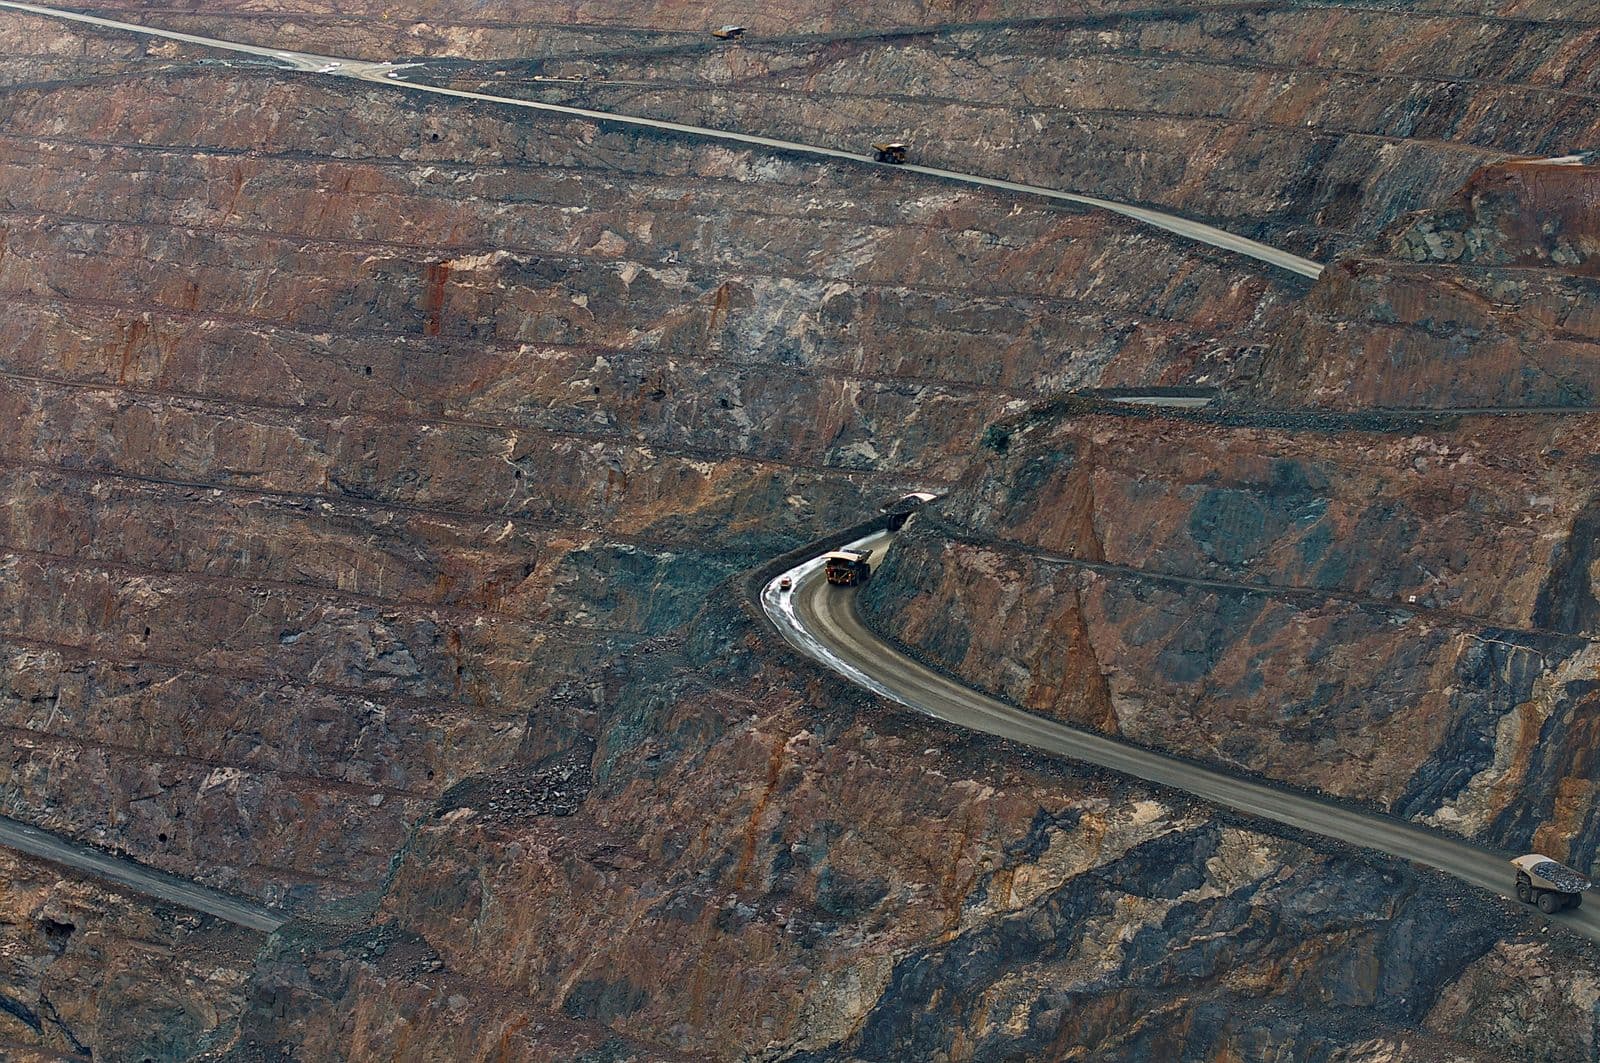
Most mine sites know roughly what they spend on tyres each year. Far fewer can explain why that number moved, which trucks or positions are driving it, or whether the latest change in brand or pressure policy actually worked.
That gap comes down to measurement. Tyres generate plenty of data through inspections, pressure checks and removals, but unless it is turned into a small set of consistent KPIs, it stays as noise. This article covers the tyre KPIs that matter most for a mining maintenance manager, how to calculate them and what each one tells you.
1. Cost per hour (CPH)
Cost per hour is the headline tyre KPI in mining, and for good reason. It turns tyre spend into a figure you can compare across brands, sizes, positions and sites.
How to calculate it: total cost of the tyre divided by the operating hours it delivered.
Total cost should include the purchase price plus any repair or retread costs over the tyre's life. Hours should come from the hours actually run on the tyre, not the age of the tyre.
As an illustration, a tyre that costs $40,000, has $2,000 of repairs and runs 7,000 hours has a CPH of $6.00. A cheaper tyre at $34,000 that only reaches 5,000 hours comes in at $6.80. The cheaper tyre is the more expensive one to run.
What it tells you: which tyre choices give you the most value per operating hour. Track it by brand, vehicle model, wheel position and site, and watch the trend over time rather than a single figure.
2. Average tyre life at removal
CPH depends heavily on how many hours a tyre lasts, so it is worth tracking tyre life on its own.
How to calculate it: the average operating hours of tyres at the point they are removed from service, split by brand, size and position.
What it tells you: whether tyres are reaching their expected life. A drop in average life on one fleet or position is often the first sign of a problem with pressure, haul road condition, loading or driving behaviour.
3. Premature removal rate
Not every removal is equal. A tyre that comes off worn to its limit has done its job. A tyre that comes off early because of a cut, impact, separation or heat damage is lost value.
How to calculate it: the share of removals that happened before the tyre reached its planned end of life, usually by recording a clear removal reason at every change.
What it tells you: how much tyre life you are losing to avoidable causes. Broken down by reason, it points directly to what to fix, whether that is haul road maintenance, spillage control, pressure discipline or operator behaviour.
This KPI only works if removal reasons are recorded consistently. A short, fixed list of reason codes beats free-text notes every time.
4. Tread utilisation at scrap
A tyre removed with a lot of tread still left has been paid for but not used.
How to calculate it: the percentage of the original tread depth that was worn away by the time the tyre was scrapped. Compare remaining tread depth at scrap against original tread depth.
What it tells you: whether tyres are being run to their full potential. Low utilisation usually means tyres are being scrapped because of damage rather than wear, which links back to premature removals. Consistently high utilisation means your tyres are working for their whole life.
5. Pressure compliance
Incorrect inflation is one of the most common contributors to early tyre failure. Under-inflation causes excessive flexing and heat, while over-inflation makes tyres more vulnerable to impact and cuts.
How to calculate it: the percentage of pressure readings that fall within an agreed tolerance of the target pressure for that tyre and position. Many operations use a band such as plus or minus 10 percent of the target cold pressure, but the right band depends on your tyre supplier's guidance.
What it tells you: how well your pressure policy is being followed in the field. Track compliance by site and by fleet, and look at under- and over-inflation separately because they have different causes.
6. Inspection compliance
All of the KPIs above depend on data from the field. If inspections are skipped, problems are found late and the numbers become unreliable.
How to calculate it: completed inspections divided by scheduled inspections over a period, by site and by crew.
What it tells you: whether your inspection routine is actually happening. A falling compliance rate is an early warning, often before tyre costs start to rise.
7. TKPH: site versus tyre rating
TKPH (tonne-kilometres per hour) measures the working load placed on a tyre in terms of heat generation. Tyre manufacturers publish a TKPH rating for each tyre, and operations calculate a site or haul cycle TKPH from the average load carried per tyre and the average operating speed over the shift.
What it tells you: whether your tyres are being worked harder than they are rated for. When the site TKPH approaches or exceeds the tyre's rating, heat-related damage such as separations becomes much more likely. This is especially relevant on long, fast hauls and in hot climates.
8. Tyre-related downtime
Ultimately tyres matter because a truck without serviceable tyres is not moving material.
How to calculate it: the hours that equipment is unavailable because of tyre issues, including unplanned failures and time spent waiting for a tyre change.
What it tells you: the production impact of your tyre programme. It also helps make the case for investment in inspections, spares holding or better tyre handling equipment, because it ties tyre performance to tonnes moved.
Keep the list short and consistent
It is tempting to track everything. In practice, a handful of KPIs reported the same way every month is far more useful than a long dashboard nobody trusts. A sensible starting set is:
- Cost per hour, by brand, position and site
- Average tyre life at removal
- Premature removal rate, by reason
- Pressure compliance
- Inspection compliance
Add TKPH, tread utilisation and downtime as your data matures.
Two rules make the difference between KPIs that drive action and KPIs that get ignored. First, define each one clearly and calculate it the same way at every site. Second, get the data from the field as it happens rather than reconstructing it from paper weeks later.
Conclusion
Tyre KPIs turn a large, opaque cost into something you can manage. Cost per hour shows where the money goes, removal and tread data show why tyres come off, and compliance measures show whether your crews have the routines in place to prevent problems.
TyreMetric calculates these numbers from the inspections, pressure checks and tyre changes your crews already record on the mobile app, with reports for running cost, scrap analysis, pressure, tyre condition and TKPH across every site. If you want to see your own tyre KPIs without building another spreadsheet, request a demo.